
🔹 Introduction to Technical Analysis in Trading
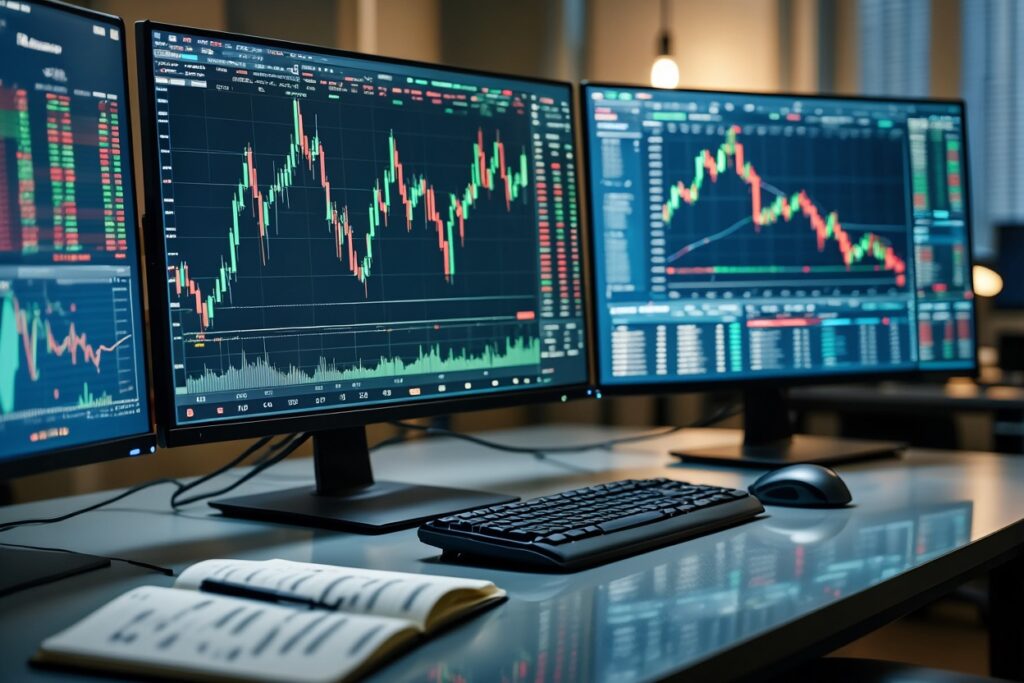
When most people think about trading, they imagine complicated charts filled with lines, colors, and patterns. That’s technical analysis (TA) in action. Unlike fundamental analysis, which studies the “value” of an asset, technical analysis looks at price movements, trends, and historical data to predict what might happen next.
Whether you’re trading stocks in the Indian market, investing in crypto, or trading forex, technical analysis is one of the most popular tools used by traders around the world.
🔹 What Is Technical Analysis? (Definition & Basics)
Technical analysis is the study of past price action and trading volume to forecast future price movements.
Instead of asking “Is this company undervalued?” (like in fundamental analysis), technical analysts ask:
- Where is the market trending?
- Are buyers or sellers stronger right now?
- At what price levels are people likely to buy or sell?
It’s based on the belief that history often repeats itself in the markets – and price patterns can reveal hidden opportunities.
🔹 Core Principles of Technical Analysis for Traders
- Price Discounts Everything
All known information – news, earnings, economic data is already reflected in the price. - Prices Move in Trends
Markets don’t move randomly; they follow trends (uptrend, downtrend, or sideways). - History Tends to Repeat Itself
Market psychology creates repeating patterns such as head-and-shoulders, double tops, or triangles.
Popular Tools in Technical Analysis
1. Charts
The foundation of TA. Common types include:
- Line charts
- Bar charts
- Candlestick charts (most widely used)
2. Indicators and Oscillators
Mathematical calculations based on price/volume. Popular ones:
- Moving Averages (MA)
- Relative Strength Index (RSI)
- MACD (Moving Average Convergence Divergence)
- Bollinger Bands
3. Chart Patterns
Visual formations that indicate potential moves:
- Head and Shoulders
- Double Top / Bottom
- Flags and Pennants
4. Support and Resistance
Key price levels where buying or selling pressure tends to appear.
Technical Analysis vs Fundamental Analysis
| Feature | Technical Analysis | Fundamental Analysis |
| Focus | Price charts & indicators | Company financials & economy |
| Timeframe | Short to medium term | Long term |
| Tools | Candlesticks, RSI, MACD | Balance sheets, P/E ratio |
| Best for | Traders | Investors |
👉 In practice, many traders use both for better decision-making.
🔹 Benefits of Using Technical Analysis in Trading
✅ Works across markets (stocks, forex, crypto)
✅ Helps identify entry and exit points
✅ Useful for short-term and swing trading
✅ Easy to visualize with charts
🔹 Limitations of Technical Analysis You Should Know
❌ Not 100% accurate – markets can be unpredictable
❌ Works better with liquid, high-volume assets
❌ Can lead to “analysis paralysis” with too many indicators
How to Get Started with Technical Analysis
- Learn the basics of candlestick charts
- Start with simple indicators like Moving Averages & RSI
- Use demo accounts before risking real money
- Keep it simple – don’t overload with too many tools
💡 Pro Tip: Focus on price action first, then add indicators for confirmation.

External Resource
If you want to dive deeper into technical analysis concepts, check out Investopedia’s Technical Analysis Guide — it’s a reliable resource for beginners.
🔹 Conclusion: Why Every Trader Should Learn Technical Analysis
Technical analysis is like learning a new language – the language of price charts. With practice, you’ll start recognizing patterns and signals that guide smarter trades. Remember, no method guarantees profits, but when combined with discipline and risk management, TA can be a powerful edge in your trading journey.
👉 Want to go deeper? Check out my separate guides on Technical analysis in Indian stocks, crypto Technical analysis, and forex analysis.
🔹 Frequently Asked Questions (FAQ) on Technical Analysis
Q1. Can beginners use technical analysis?
Yes! Start with basics like support, resistance, and trendlines before moving to advanced indicators.
Q2. Is technical analysis reliable for crypto trading?
It works, but crypto is more volatile. Combine TA with risk management.
Q3. Which is better: technical or fundamental analysis?
Neither is “better.” Traders prefer TA, investors lean toward FA. Many successful market participants use both.
Q4. Do I need paid software for technical analysis?
Not necessarily. Free platforms like TradingView offer great charting tools.

