Introduction
Crypto markets never sleep. This crypto technical analysis for beginners guide will teach you how to interpret price action and volume patterns on Bitcoin, Ethereum, and altcoins. You’ll learn chart types, key indicators, and practical trading tips to manage 24/7 volatility.

Crypto Market Basics
Unlike stocks, crypto trades across multiple exchanges around the clock.
Core concepts:
- Pair: Base and quote currency (e.g., BTC/USDT)
- Order Types: Market, limit, stop-limit
- Liquidity: Depth of buy and sell orders
Grasping these fundamentals will make it easier to apply technical analysis.
What Is Technical Analysis in Crypto?
Technical analysis examines historical price and volume data to predict short-term moves. In the crypto world, it’s indispensable for spotting momentum swings and identifying support or resistance on volatile assets.
Key Tools
- Chart Styles: Candlestick, Heikin-Ashi, Renko
- Indicators: RSI, MACD, Bollinger Bands
- Volume and Order-book Data
These form the backbone of every chart reading session.
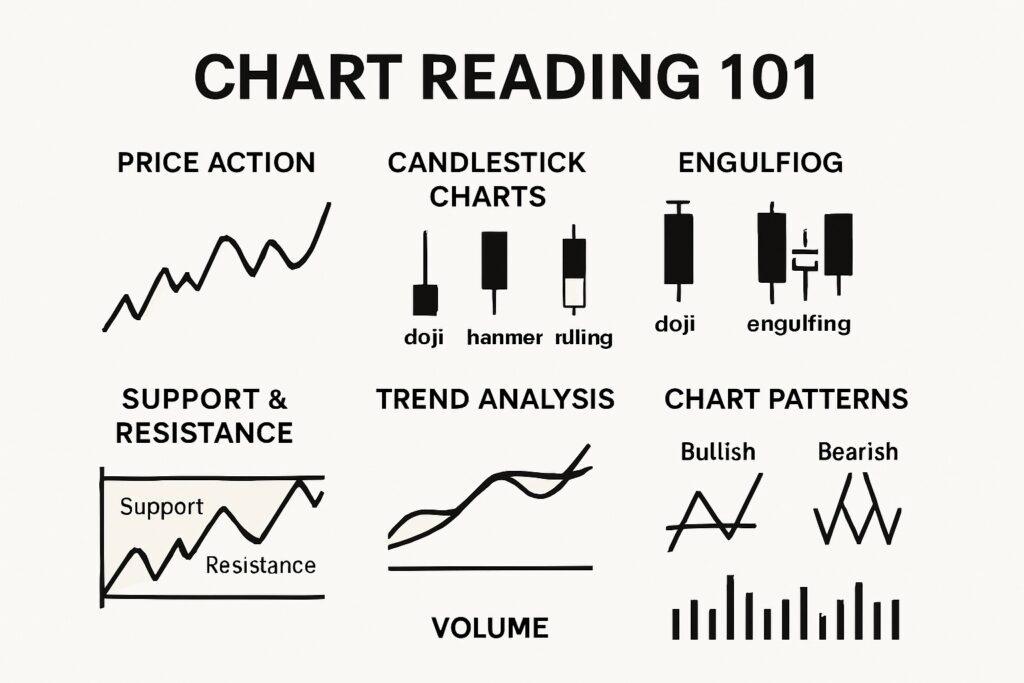
Chart Reading Essentials
- Timeframes: 15-minute, hourly, daily charts depending on your style
- Candlestick Patterns:
- Spinning Top: Market indecision
- Shooting Star: Potential bearish reversal
- Bullish Engulfing: Strong bullish signal
- Volume Profile: Highlights price areas with high trading activity
Go-To Indicators
- EMA Crossovers (e.g., 9 and 21 EMA) for trend confirmation
- RSI (14-period) for spotting overbought/oversold zones
- MACD for detecting shifts in momentum
Stick to two indicators to maintain clarity.
Trading Tips
- Use lower timeframes to enter and exit precisely
- Always account for exchange fees when sizing positions
- Employ risk-reward ratios (1:2 or better)
- Keep a trading journal to track performance
While we focus here on candlestick patterns and EMA crossovers, don’t overlook on-chain metrics – Coinpaper’s Top 10 Crypto Analysis Websites list is a great next step for tracking whale movements and sentiment data.
Mistakes to Avoid
- Chasing breakouts without volume confirmation
- Ignoring market sentiment and news catalysts
- Trading too many pairs at once
- Neglecting position sizing rules
Step-by-Step Tutorial
- Select a crypto pair and timeframe
- Determine the prevailing trend via EMA or Moving Averages
- Identify support/resistance zones on recent swings
- Apply RSI or MACD for entry signals
- Confirm with volume spikes or order-book imbalances
- Define entry, exit, and stop-loss levels before trading
Conclusion
Crypto technical analysis helps you make sense of nonstop price action. By combining disciplined chart reading, thoughtful indicator use, and solid trading tips, you’ll navigate the crypto market’s highs and lows with greater confidence.