
What is a Doji Candlestick?
A Doji candlestick forms when a stock or crypto asset opens and closes at nearly the same price. On the chart, it looks like a cross or plus sign – showing that neither buyers nor sellers gained full control during that trading session.

In simple terms, a Doji represents indecision in the market. It often appears after a strong uptrend or downtrend, signaling that momentum might be weakening and a potential reversal or pause could follow.
Psychology Behind the Doji
The Doji reflects a battle between bulls and bears.
- Buyers push the price up during the session.
- Sellers push it back down.
- The session ends near where it started.
This tug-of-war creates uncertainty. Traders watch closely – if the next candle confirms direction, a trend reversal or continuation setup may form.
Types of Doji Candlestick Patterns
There are several types of Doji patterns, each with unique implications:

1. Doji
- Open and close are almost equal.
- Appears after extended moves.
- Suggests a neutral stance – wait for confirmation.
2. Dragonfly Doji
- Looks like a “T”.
- Open, high, and close are almost the same, with a long lower shadow.
- Found at the bottom of a downtrend – often signals bullish reversal potential.
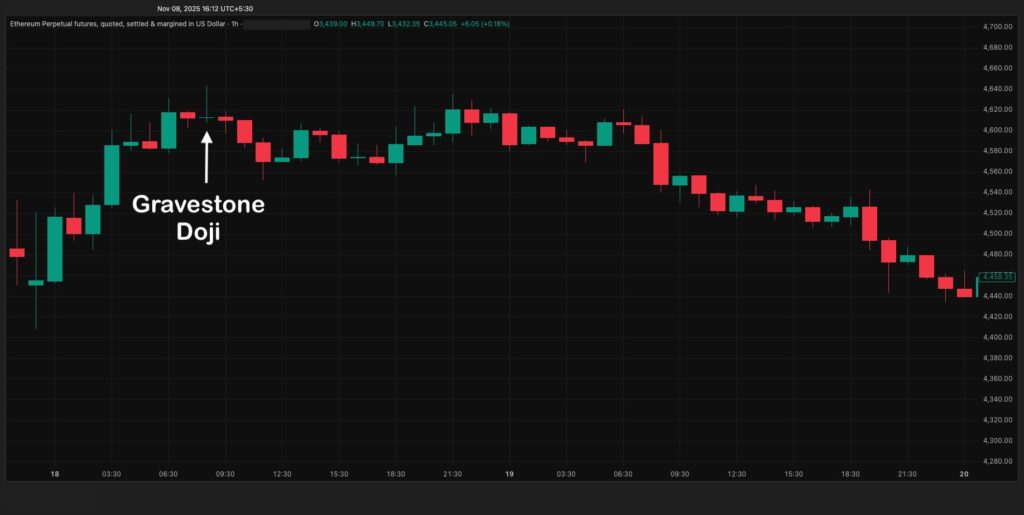
3. Gravestone Doji
- Inverted “T” shape.
- Open, low, and close are nearly the same, with a long upper shadow.
- Appears at the top of an uptrend – often warns of bearish reversal.
How to Trade Doji Patterns
Trading the Doji is not about spotting it alone – confirmation is key.
- Identify the Doji: Look for a candle where the open and close are nearly equal.
- Check the trend: If it appears after a strong move, it may hint at exhaustion.
- Wait for confirmation:
- Bullish reversal → follow-up green candle with strong volume.
- Bearish reversal → follow-up red candle breaking below the Doji’s low.
- Set stop-loss: Place it slightly below (for bullish) or above (for bearish) the Doji wick.
Pro Tip: Combine Doji signals with support/resistance and volume or RSI indicators for higher accuracy.
Real Chart Example
Imagine a stock that’s been rising for several days. Suddenly, a Gravestone Doji forms at the top – with a long upper shadow.
The next candle turns red and closes below the Doji’s low.
This confirms seller strength, signaling a potential trend reversal.


Doji vs Spinning Top
Many traders confuse Doji with Spinning Top.
Here’s how they differ:
| Feature | Doji | Spinning Top |
|---|---|---|
| Body | Very small or none | Small but visible |
| Indication | Strong indecision | Mild indecision |
| Confirmation need | High | Moderate |
In short, all Dojis show indecision, but not all indecisive candles are Dojis.
Confirmation with Volume or RSI
- High Volume: Strengthens the Doji signal – large participation means traders are taking notice.
- RSI Divergence: If RSI shows divergence when a Doji appears, reversal chances rise significantly.
- Example: Price forms a Dragonfly Doji at the bottom while RSI turns up → potential bullish reversal.
Common Mistakes When Trading Dojis
- Trading Doji in sideways markets – avoid choppy conditions.
- Ignoring confirmation candles – leads to false signals.
- Placing trades without stop-loss – always manage risk.
- Assuming every Doji means reversal – sometimes it only means a pause.
FAQ & Summary
Q1: Is a Doji candle bullish or bearish?
It depends on context. On its own, a Doji is neutral – confirmation determines the direction.
Q2: What time frames are best for Doji patterns?
They work across all timeframes, but higher ones (1H, 4H, Daily) are more reliable.
Q3: Can I trade Doji without indicators?
You can, but combining it with RSI or volume analysis improves accuracy.
Q4: Are Dojis rare?
Not rare – but context and confirmation make them meaningful.
Summary
The Doji candlestick pattern is a powerful visual signal of market indecision.
By understanding its types – from Dragonfly to Gravestone – and combining it with volume or RSI confirmation, traders can spot early signs of reversals or pauses.
Use Doji patterns as a decision support tool, not a standalone signal – and always manage your risk with proper stop-loss and trade planning.

