
Spinning Top Candlestick Pattern: Unpacking Market Indecision
The world of financial trading often feels like a high-stakes guessing game, but for those who know how to read the language of the market, valuable clues are constantly being dropped. One of the most common and clear clues is the Spinning Top candlestick pattern. This small, unassuming candle is a powerful signal of market indecision, and understanding it is key to anticipating future price moves.
🧐 Definition
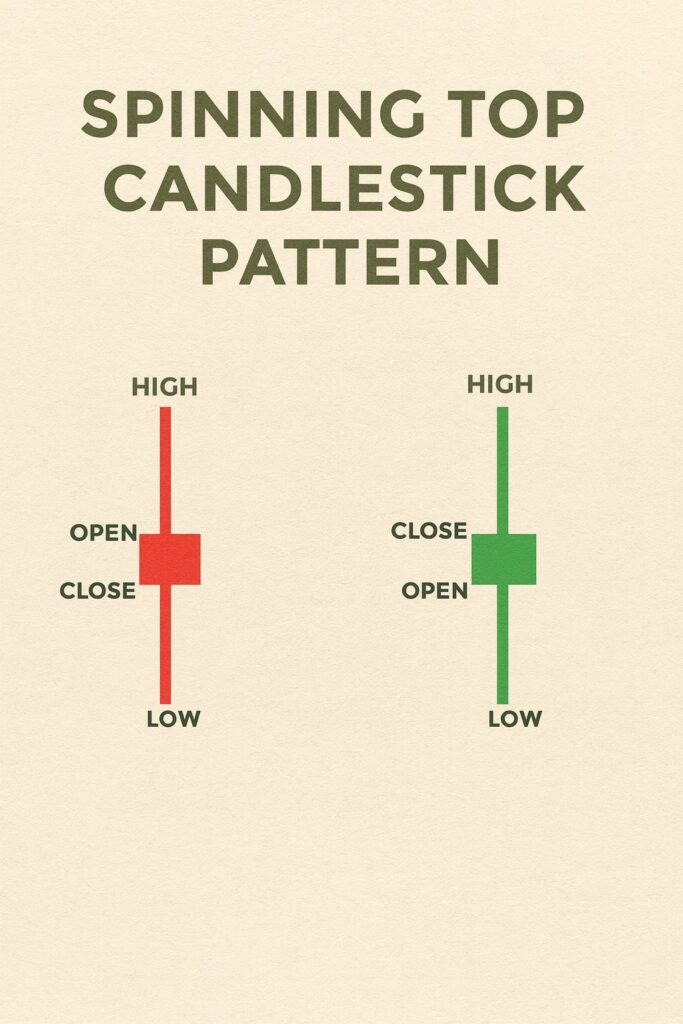
A Spinning Top is a candlestick pattern characterized by a small body centered between two relatively long upper and lower shadows (wicks).
- Small Body: This indicates that the opening and closing prices were very close to each other.
- Long Shadows: These show that despite the close opening and closing prices, the price moved significantly higher and lower during the period.
The color of the body (green/bullish or red/bearish) is less important than its size and the length of the wicks. It simply tells us whether the close was slightly above or slightly below the open.
⚙️ How It Forms
The formation of a Spinning Top is a mini-drama played out over one trading period:
- Opening: The period begins with the price opening.
- Bullish Push: Buyers (bulls) take control, pushing the price significantly higher, creating the upper shadow.
- Bearish Push: Sellers (bears) step in, driving the price all the way down, past the opening price, creating the lower shadow.
- Balance & Closing: By the end of the period, neither the bulls nor the bears could sustain their momentum. The price closes very near the opening price.
This back-and-forth battle, where large moves are made but ultimately canceled out, is what signals indecision or a standoff between supply and demand.
📈 Trading Significance
The primary significance of a Spinning Top is a pause or neutrality in the current market movement. It tells traders to hit the brakes and reassess the situation.
- It is not a direct signal for a trade. It is a warning or confirmation signal.
- The context (where it appears on the chart) dictates its true power.
🔄 Role in Trend Reversals and Consolidation
The meaning of a Spinning Top changes drastically depending on its location on the price chart:
Trend Reversals
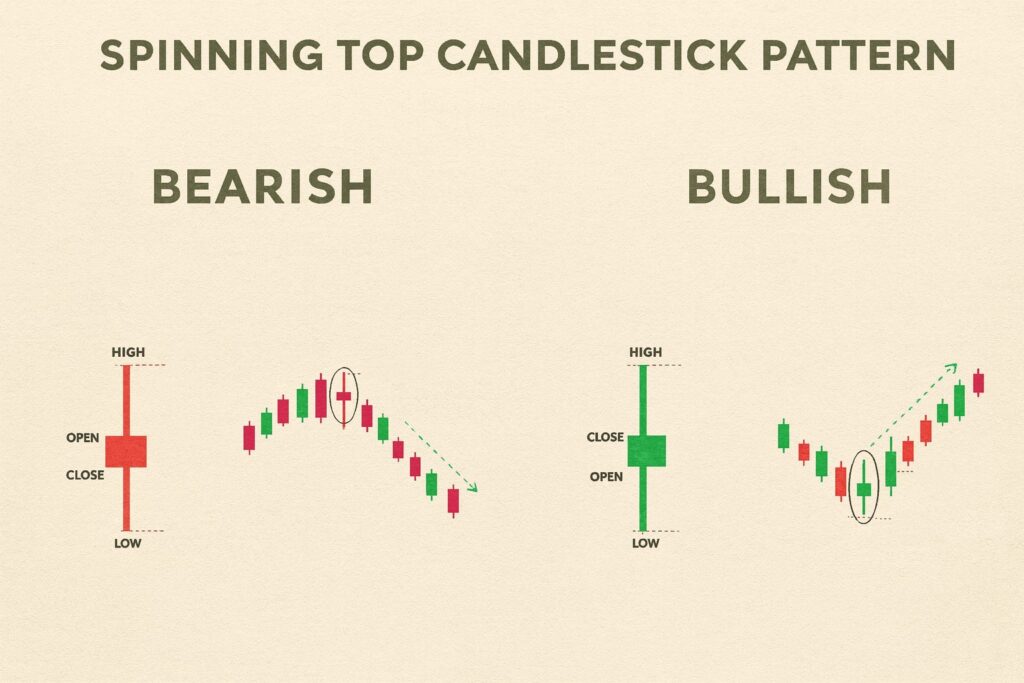
When a Spinning Top appears after a strong, prolonged up-trend or down-trend, it is a strong hint that the trend may be exhausting itself.
- After an Uptrend: The long lower shadow shows sellers are starting to exert pressure, and the bulls are having trouble maintaining control. This is an early warning of a potential reversal to a downtrend.
- After a Downtrend: The long upper shadow shows buyers are starting to step in, and the bears are struggling to push prices lower. This is an early warning of a potential reversal to an uptrend.
Consolidation
When a series of Spinning Tops and other small-bodied candles appear in the middle of a chart without a clear trend, it often indicates a period of consolidation (sideways trading). The market is simply waiting for a new catalyst or direction, and neither bulls nor bears have the conviction to start a new move yet.
✅ Confirmation Techniques
Never trade based on a single candlestick pattern! A Spinning Top must be confirmed by the price action in the subsequent period.
- Directional Confirmation: Wait for the next candle to close in the direction of the expected move.
- Example (Reversal after Uptrend): If the Spinning Top appears after an uptrend, you look for the next candle to be a large bearish (red) candle that closes below the Spinning Top’s low. This confirms the sellers have taken control.
- Volume Confirmation: Look for a spike in trading volume on the confirmation candle. High volume suggests that the change in direction is being backed by significant institutional money, increasing the probability of a true reversal.
- Support/Resistance: The pattern is much more reliable when it forms near a key support or resistance level on the chart.
Spinning Top vs. Doji
While similar, a Spinning Top is not a Doji. They both signal indecision, but with a subtle difference:
| Feature | Spinning Top | Doji |
| Body | Small but visible | Virtually non-existent (Open = = Close) |
| Indecision Level | High, but shows a slight winner | Extreme and perfect balance |
| The Takeaway | There was a fight, and a slight winner emerged. | It was a perfect stalemate. |

📝 Summary
The Spinning Top is a must-know pattern for any technical analyst. It represents a powerful moment of balance and hesitation, often preceding a major shift in trend. Always remember: context is everything.
FAQ
Q: Is a green (bullish) Spinning Top always a bullish signal?
A: No. The color is secondary. If a green Spinning Top appears after a long downtrend, it can be a sign of a potential reversal to the upside (bullish). If it appears after a long uptrend, it is still a bearish warning sign of potential exhaustion.
Q: Should I exit a trade when I see a Spinning Top?
A: Not immediately. The Spinning Top is your warning. You should tighten your stop-loss and wait for the confirmation candle in the following period to validate the potential trend change before exiting.
Q: Does the size of the wicks matter?
A: Yes. The longer the wicks (shadows), the more intense the fight between buyers and sellers was, which makes the indecision signal more significant.

