
Three Black Crows Pattern – Bearish Continuation
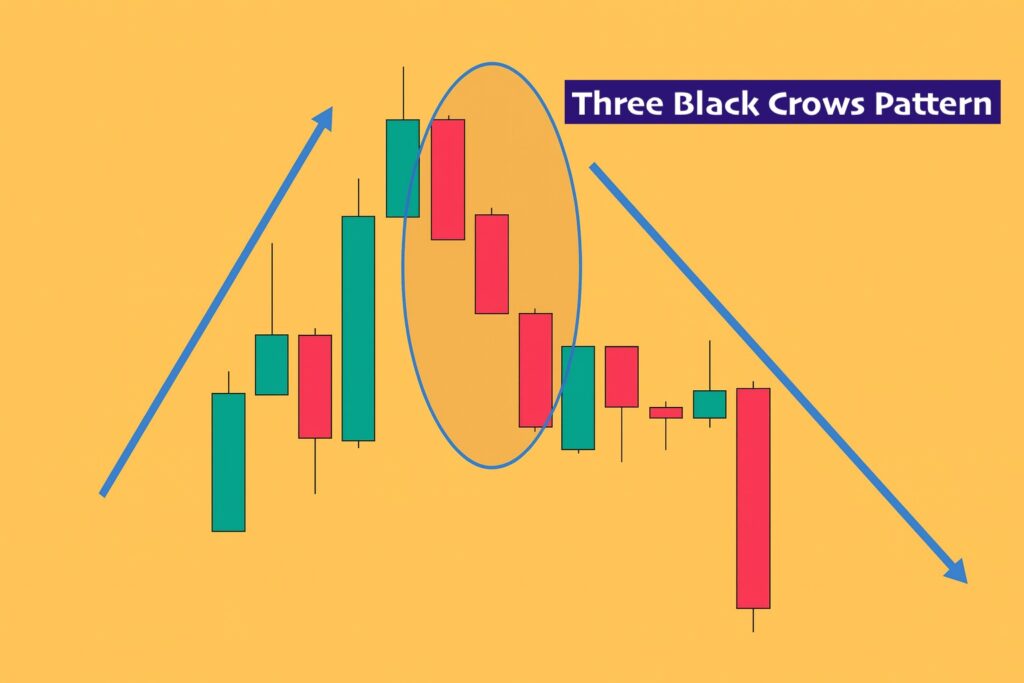
The market often gives subtle signs before continuing a downtrend, and one of the clearest candlestick signals is the Three Black Crows Pattern. This pattern appears after an uptrend or a temporary pullback and signals strong selling pressure returning to the market. Traders use it to confirm bearish momentum and position themselves for trend continuation.
Let’s break it down in simple terms.

Definition
The Three Black Crows Pattern is a three-candle bearish continuation pattern that forms when:
- Three consecutive bearish candles appear.
- Each candle opens inside or near the previous candle’s body.
- Each candle closes lower, showing consistent seller dominance.
It confirms that bears have taken control and that a downtrend is likely to continue.
Candle Sequence (Structure)
A valid Three Black Crows pattern includes:
1️⃣ First Crow
- Appears after an uptrend or bullish correction.
- Indicates the first hint of selling pressure.
2️⃣ Second Crow
- Opens within the body of the first candle.
- Closes lower, confirming bearish momentum.
3️⃣ Third Crow
- Continues the downward move.
- A strong bearish close confirms trend continuation.
Important Note:
Long wicks or small bodies weaken the pattern. Ideally, all three candles should have long bodies and short wicks, representing strong bearish control.
Market Context
The pattern carries the most weight when it appears:
- At the top of an uptrend
- After a bullish retracement in an existing downtrend
- Near key resistance zones
- When the market is overbought
- Alongside weakening bullish indicators
The Three Black Crows essentially represent three consecutive failures by buyers, proving that the downward pressure is real and sustained.
Trading Setup
Here’s a simple, practical way to trade this pattern:
1. Identify the Pattern
Wait for all three bearish candles to complete.
Never enter early.
2. Entry
Enter a sell trade after the third candle closes.
3. Stop-Loss Placement
Place SL at:
- Above the high of the third candle
or - Above the pattern’s highest wick
or - Above nearby resistance
4. Take-Profit Targets
Use any of these:
- Nearest support levels
- Fibonacci extension levels
- Previous swing lows
- Risk–reward ratios (1:2 or 1:3)
5. Add Confluence
For higher accuracy:
- RSI below 50 or overbought drop
- MACD bearish crossover
- Trendline rejection
- Volume increase during pattern formation
Confirmation Signals
To increase reliability, combine the pattern with:
- RSI breakdown from overbought levels
- Bearish divergence
- MACD histogram turning negative
- Break of minor support zones
- High trading volume on the bearish candles
Common Mistakes
Avoid these pitfalls:
❌ Entering Before Pattern Completes
All three candles must fully form.
❌ Trading It In Sideways Market
Works poorly in choppy or low-volume markets.
❌ Ignoring Strong Support Zones
If support is close, the pattern may fail or bounce.
❌ Extremely Long Candles
Unusually long candles might signal exhaustion rather than continuation.
❌ No Stop-Loss
Even strong patterns require risk management.
Summary
The Three Black Crows Pattern is a dependable bearish continuation candlestick formation that signals a shift in momentum from bulls to bears. When combined with proper market context, key levels, and technical indicators, it offers traders a strong opportunity to enter short positions with confidence.
FAQ
1. Is the Three Black Crows pattern always bearish?
Yes, it’s strictly a bearish continuation or reversal-to-continuation signal.
2. Can beginners use this pattern?
Yes. It’s easy to recognize and reliable when paired with confirmations.
3. Which timeframe is best?
H4, Daily, and Weekly charts provide the strongest signals, but it works on any timeframe.
4. Does it work in crypto, stocks, and forex?
Absolutely – its psychology applies across all markets.
5. How do I know it’s not a false signal?
Ensure it forms near resistance and confirm with indicators or volume.

