
Bearish Engulfing Pattern – Identifying Trend Reversals
When the market rallies for a while, traders look for signals that the trend may be weakening. One of the strongest candlestick signals for a potential downside reversal is the Bearish Engulfing Pattern. This pattern is simple yet powerful, and when used with proper confirmation, it can help traders anticipate trend shifts with accuracy.
What Is a Bearish Engulfing Pattern? (Definition)
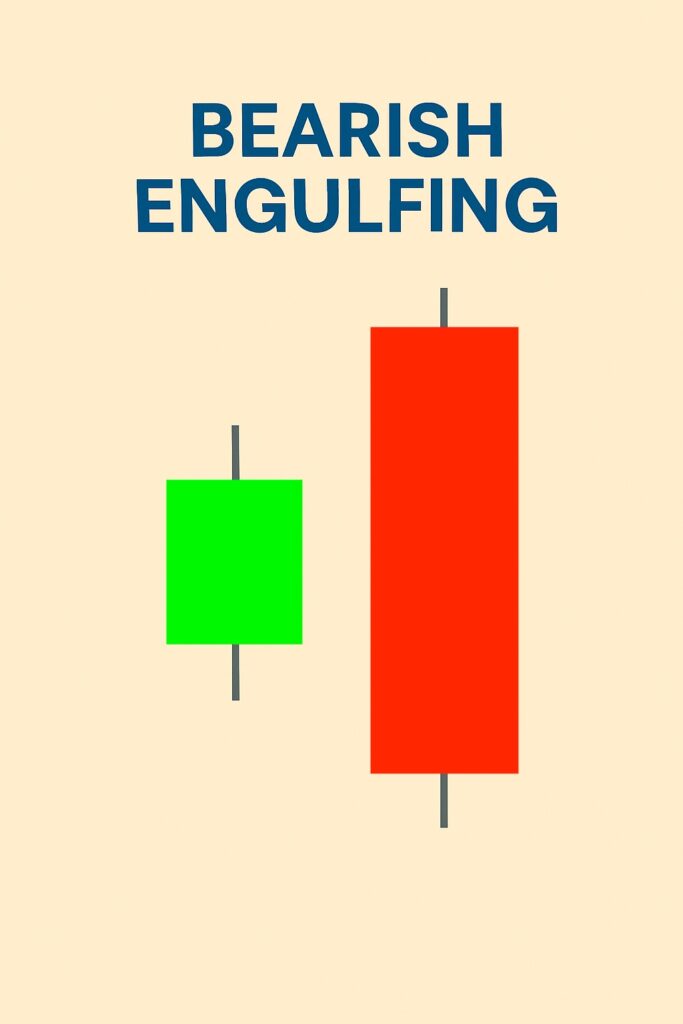
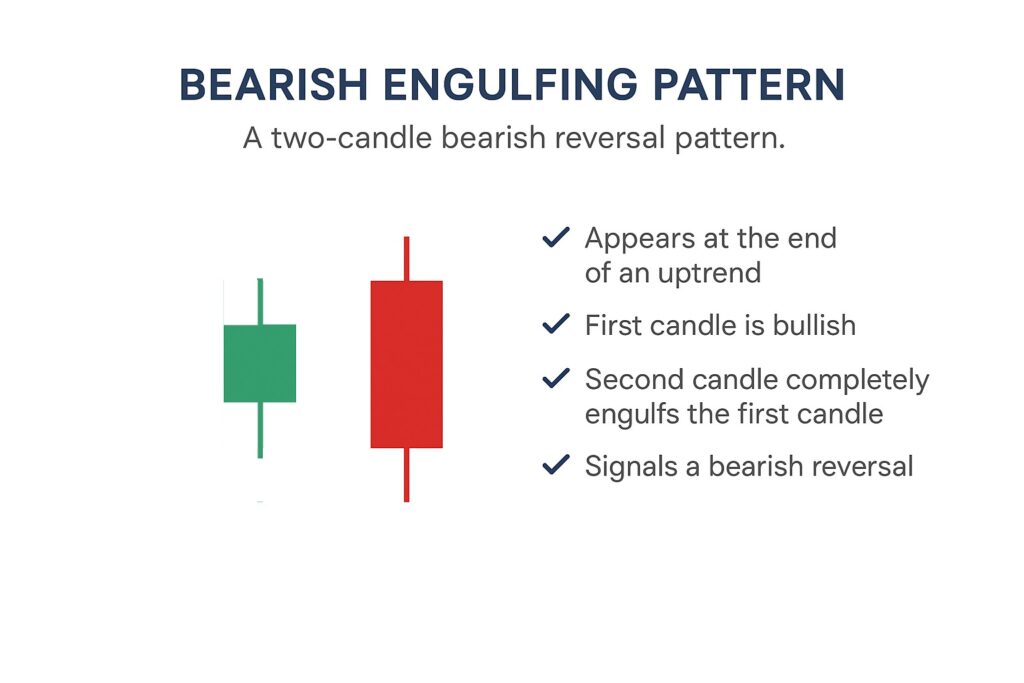
A Bearish Engulfing Pattern is a two-candle reversal pattern that appears at the top of an uptrend.
It forms when:
- The first candle is bullish (green).
- The second candle is bearish (red) and completely engulfs the body of the previous candle.
The engulfing candle shows a sudden surge in selling pressure, suggesting that buyers are losing control.
Psychology Behind the Pattern
Understanding the psychology helps you trust the pattern:
- The market is in an uptrend, and buyers feel confident.
- A bullish candle forms first, continuing the upward sentiment.
- Then suddenly, the next candle opens above or near the previous close — but sellers aggressively push the price down.
- The candle closes well below the previous candle’s open.
This shift from strong buying to overwhelming selling signals a potential reversal from bullish to bearish momentum.
Setup & Identification
To correctly identify a Bearish Engulfing Pattern, look for:
1. Clear Uptrend
The pattern is meaningful only when it appears after a series of higher highs and higher lows.
2. Small Bullish Candle
The first candle shows decreasing buyer strength if its body is small.
3. Large Bearish Candle
The second candle should:
- Have a body that fully covers the previous candle’s body.
- Close below the previous candle’s open.
4. Volume (Optional but Helpful)
Higher volume during the engulfing candle strengthens the signal.
How to Trade a Bearish Engulfing Pattern (Trading Strategy)
A practical trading approach:
1. Entry
- Enter a short position after the bearish engulfing candle closes.
- Conservative traders wait for a break below the engulfing candle’s low.
2. Stop-Loss
Place your stop-loss:
- Above the high of the engulfing candle (safer)
or - Above the previous swing high.
3. Targets
Use any of the following:
- Nearest support levels
- Fibonacci retracement levels
- Moving averages
- Risk-reward ratios like 1:2 or 1:3
4. Add Confirmation
Combine with indicators for higher accuracy:
- RSI overbought (above 70)
- Bearish divergence
- MACD bearish crossover
- Resistance zone rejection
Confirmation Methods
Although the Bearish Engulfing Pattern is strong by itself, confirmation increases reliability.
- Break of structure (lower low formed)
- Strong follow-through candle after the engulfing candle
- Volume spike during the engulfing move
- Retest of resistance before selling continues
- Indicators aligning with bearish bias (RSI, MACD, Stochastic)
Common Mistakes to Avoid
1. Trading It in a Sideways Market
The pattern is most powerful at the end of an uptrend, not in consolidation.
2. Ignoring Support Zones
If support is too close, your trade may stall or reverse.
3. Using It Alone Without Confirmation
Candlestick patterns work best with context and confluence.
4. Entering Before Candle Close
Wait for the candle to fully form to avoid false engulfing signals.
5. Using Tight Stop-Losses
Bearish engulfing candles are often large; leaving enough room helps avoid premature stop-outs.
FAQ
1. Is a Bearish Engulfing Pattern always a reversal signal?
Not always. It is most reliable when it forms at resistance or after a strong uptrend.
2. Can beginners use this pattern?
Yes. It is simple to recognize and works well when combined with basic risk management.
3. What timeframe works best?
Higher timeframes (1H, 4H, Daily) produce more reliable signals, but it works on all timeframes.
4. Should I use indicators with it?
Yes – indicators like RSI, MACD, and support–resistance zones improve accuracy.
5. What makes a strong Bearish Engulfing Pattern?
A big bearish candle, high volume, and formation near a key resistance zone.

