
Tweezer Bottom Pattern – Bullish Reversal at Support
When markets fall for a while, traders search for early signs that the downtrend might be losing steam. One of the most reliable candlestick signals for a potential upward reversal is the Tweezer Bottom Pattern. Simple yet highly effective, this pattern highlights a shift from strong selling pressure to renewed buying interest.

Let’s break down what the pattern is, how it forms, and how you can use it to catch bullish reversals with confidence.
Definition – What Is a Tweezer Bottom Pattern?
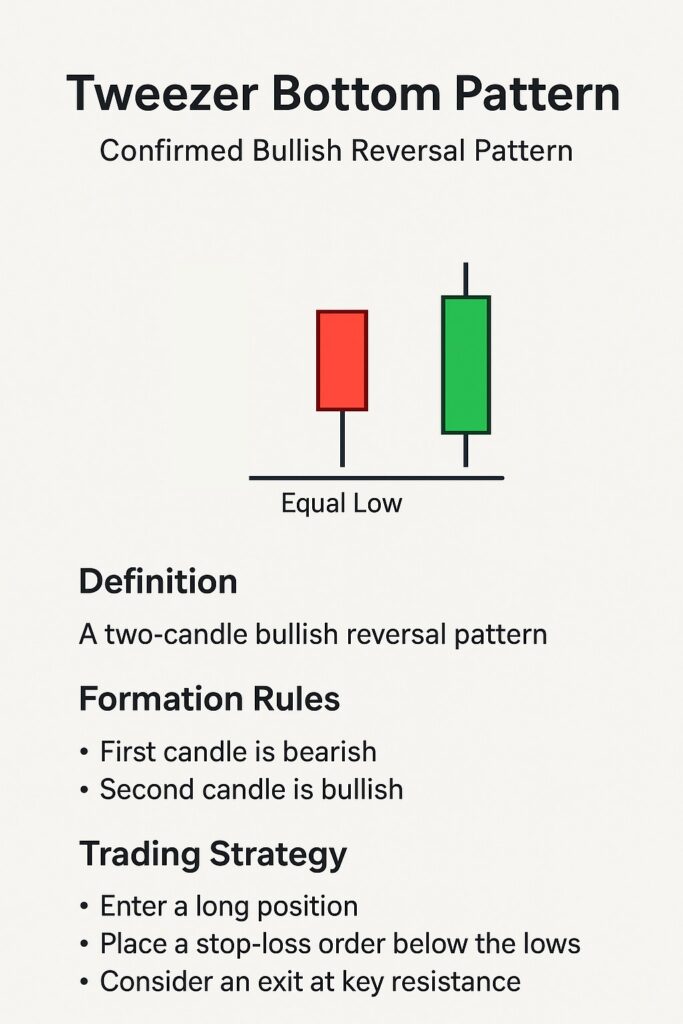
A Tweezer Bottom is a bullish two-candle reversal pattern that appears at the bottom of a downtrend.
It forms when:
- Two consecutive candles show nearly identical lows.
- The first candle is bearish.
- The second candle is bullish, rejecting the same support level.
This equal-low structure signals that sellers attempted to break below a support zone twice, but buyers stepped in strongly both times.
Candle Setup
A valid Tweezer Bottom pattern typically consists of:
1. First Candle (Bearish)
- Indicates strong selling pressure
- Closes near its low
- Attempts to break support
2. Second Candle (Bullish)
- Opens near or below the previous close
- Tests the same low again
- Buyers push price up strongly, forming a bullish candle
Key Feature:
Both candles share almost identical lows, forming the “tweezer” shape at support.
Significance in Downtrends
The Tweezer Bottom pattern carries strong psychological and technical meaning:
✔ Buyers defend the same support twice
Sellers push price lower on both candles, but fail to break support.
✔ Shift from selling to buying
Buyers step in aggressively on the second candle, showing reversal strength.
✔ Signals exhaustion of sellers
A repeated rejection at the same low indicates that sellers may be losing momentum.
✔ Early indication of bullish reversal
This makes the pattern popular among traders who want early entries at trend reversals.
Overall, it suggests the downtrend may be ending and a new bullish structure could begin.
How to Trade the Tweezer Bottom Pattern
A simple and effective way to trade this pattern:
1. Entry
Enter a long position after the second (bullish) candle closes.
2. Stop-Loss Placement
Place your stop-loss:
- Below the tweezer lows (safer)
or - Below the nearest swing low
3. Take-Profit Targets
Use any of the following:
- Nearest resistance levels
- Fibonacci retracements (38.2%, 50%, 61.8%)
- Previous structure highs
- 1:2 or 1:3 RR ratio
4. Use Extra Confluence
Combine with:
- RSI oversold readings
- Bullish divergence
- MACD bullish crossover
- Volume spikes at support
- Support/supply zone testing
Confirmation Signals
Although the pattern is strong by itself, confirmation increases accuracy:
🚀 Break of minor resistance (structure shift)
🚀 Higher volume on the second candle
🚀 RSI moving upward from oversold
🚀 Bullish chart patterns forming nearby
🚀 Retest of support after breakout
These confirmations reduce false signals and improve win-rate.
Tweezer Bottom vs Double Bottom
| Feature | Tweezer Bottom | Double Bottom |
| Structure | 2 candles | Multi-candle pattern |
| Formation Speed | Fast | Slow |
| Lows | Nearly identical | Two major swing lows |
| Strength | Medium-strong | Stronger reversal |
| Usage | Short-term reversal | Long-term trend reversal |
While both indicate bullish reversals, the Tweezer Bottom is quicker, while the Double Bottom provides stronger trend confirmation.
Summary
The Tweezer Bottom Pattern is a clear and powerful bullish reversal signal, especially when it forms at strong support levels. It’s easy to spot, beginner-friendly, and works well across forex, crypto, stocks, and commodities.
Using confirmation signals and placing proper stop-losses improves accuracy and protects you from false breakouts.
FAQ
1. Is a Tweezer Bottom always bullish?
It strongly suggests a bullish reversal but works best with additional confirmation.
2. Which timeframe gives the most reliable signals?
Higher timeframes like H1, H4, and Daily are more reliable.
3. Can beginners use the pattern?
Yes – its simplicity makes it ideal for new traders.
4. Is it the same as a Double Bottom?
No. A Double Bottom is a bigger structure, while a Tweezer Bottom is a fast two-candle signal.
5. Where does the pattern work best?
At strong support or demand zones, especially during oversold conditions.

