
Inverted Hammer Candlestick Pattern: Meaning, Identification, Trading Strategy & Bullish Reversal Guide
Candlestick patterns are among the simplest and most powerful ways to understand market psychology. One such pattern that often signals a bullish reversal – especially after a strong downtrend is the Inverted Hammer candlestick.
In this guide, you’ll learn what an Inverted Hammer is, how to identify it, when it works best, how to trade it, and how it differs from the Shooting Star.

Definition & Structure
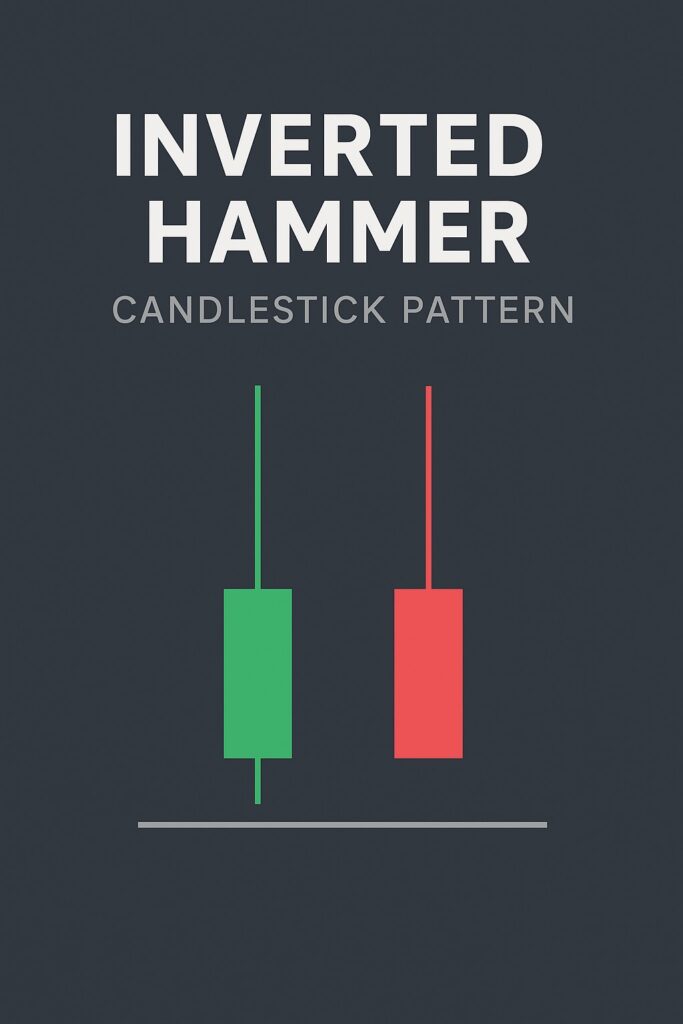
An Inverted Hammer is a single-candle reversal pattern that appears after a downtrend.
It has:
- A small body at the bottom of the candle
- A long upper wick (shadow) ideally 2–3 times the size of the body
- Little to no lower wick
- Color can be green or red (green is slightly more bullish)
This structure reflects a battle between buyers and sellers. Although sellers opened strong, buyers managed to push the price upward during the session – showing early signs of bullish interest.
What the Inverted Hammer Signals
The Inverted Hammer tells you that:
- Bears pushed the price lower earlier
- Bulls stepped in aggressively and pushed the price higher
- Sellers eventually pulled it back down, but bullish pressure was strong enough to hold above the open
- This shift suggests that selling power might be weakening
- A trend reversal may be brewing, but confirmation is required
Identification Rules
To correctly identify an Inverted Hammer, check these conditions:
- Occurs after a downtrend
- Upper wick should be long, preferably 2x–3x the body
- body is small and located near the candle’s low
- Lower wick is very small or nonexistent
- Candle color is not important, but green is more reliable
- Must be followed by confirmation (e.g., bullish candle next day)
Ideal Market Context (Support Zones)
The Inverted Hammer becomes far stronger when it forms at:
✔ Key support levels
The pattern near a previously tested support zone shows buyers defending the price.
✔ Demand zones
Smart money zones (ICT concepts) where institutional buying is likely.
✔ Fibonacci retracement levels
Especially the 61.8% or 78.6% retracement.
✔ Oversold RSI levels
If RSI is below 30, the reversal signal strengthens.
✔ End of a sharp decline
When a market drops rapidly, exhaustion usually follows – creating perfect conditions.
Context matters more than just the candle itself. The Inverted Hammer alone is a hint; the market environment makes it meaningful.
Step-by-Step Trading Strategy
Here is a simple, reliable method to trade the Inverted Hammer:
- Identify a Downtrend
- The pattern is only valid after a decline. Look for consistent lower highs and lower lows.
- Spot the Inverted Hammer
- Ensure it follows the structural rules and forms near a support level or demand zone.
- Wait for Confirmation
- This is the most important step.
- Confirmation can be:
- A strong bullish candle closing above the Inverted Hammer’s high
- Break of the candle’s high on the next session
- Avoid entering immediately after the pattern forms.
- Entry Trigger
- Enter when the price breaks above the high of the Inverted Hammer.
- Place Stop-Loss
- Two common stop-loss levels:
- Below the Inverted Hammer low
- Below the support zone (safer but larger SL)
- Take Profit Targets
- 1:2 or 1:3 risk–reward
- Next resistance zone
- Fibonacci extension levels (127% or 161.8%)
- Optional Confirmation Tools
- RSI crossing above 30
- MACD bullish crossover
- Volume spike on confirmation candle
Inverted Hammer vs. Shooting Star
Both look almost identical, but their location in the trend makes all the difference.
| Feature | Inverted Hammer | Shooting Star |
|---|---|---|
| Trend Context | Appears in a downtrend | Appears in an uptrend |
| Signal | Bullish reversal | Bearish reversal |
| Market Psychology | Buyers showing strength at lows | Sellers showing strength at highs |
| Reliability | Needs confirmation | Needs confirmation |
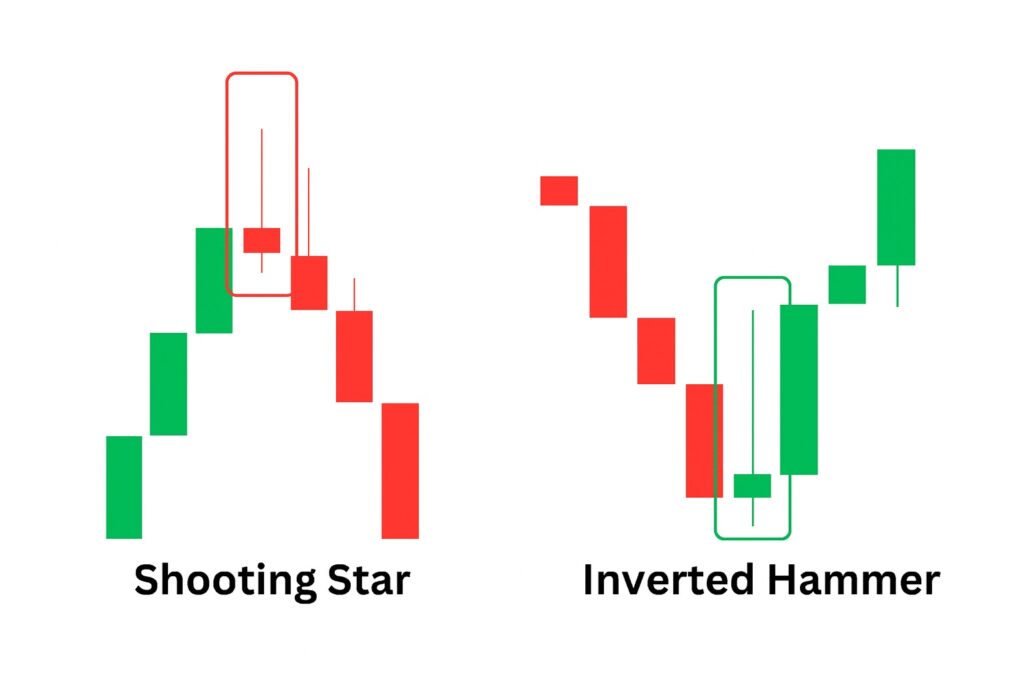
Never confuse them – trend placement is the key.
Confirmation Techniques
Use at least one of these techniques for higher accuracy:
✔ Bullish Breakout
Candle closes above the Inverted Hammer high.
✔ Increased Volume
Shows strong buying interest.
✔ Momentum Shift Indicators
- RSI moving up from oversold
- MACD bullish crossover
✔ Support Zone Bounce
If the pattern forms at a strong support level, confirmation becomes more reliable.
Common Mistakes Traders Make
- Trading without confirmation
The Inverted Hammer alone is not enough. - Ignoring the trend
If it doesn’t appear after a downtrend, it’s not valid. - Forcing trades at weak support zones
Context is everything. - Using too-tight stop-losses
Price often retests the candle’s low. - Confusing it with a Shooting Star
Same candle, different meaning depending on trend.
FAQ
1. Is the Inverted Hammer bullish or bearish?
It is a bullish reversal pattern, but only when it appears after a downtrend.
2. Does candle color matter?
Not necessary, but a green Inverted Hammer indicates stronger buying interest.
3. How reliable is the Inverted Hammer?
It is moderately reliable but requires confirmation for safe trading.
4. Can I trade the Inverted Hammer alone?
No. Always wait for a bullish confirmation candle.
5. Is the Inverted Hammer a trend reversal or trend continuation pattern?
It is a trend reversal pattern signaling possible upward movement.

